Data Breaches: How They Affect Cyber Security Stocks
This project was submitted for the Enterprise DNA Builds initiative. My goal was to prepare a Power BI report that compares the trends of two different sets of data over time.
Intro
It was just another day at the data security industry bureau, and I was getting ready to grab my third cup of coffee when my manager walked in: "Figure out how many people need to get hacked before stock prices take a hit." The project looked odd at first, but the research question was too interesting to ignore.
Concept
The idea of this project is to deliver a proof-of-concept report focused on statistical analysis and modeling of data security companies' stock prices in relation to breach quantity and impact.
- Enterprise DNA provided breach-level datasets.
- I selected major IT security companies from companiesmarketcap.com.
- I pulled stock history with the Python
yfinancelibrary.
Preparation
Using Jupyter Notebook as a support tool for Power BI development, I ran descriptive analysis and built a simple multiple linear regression model to power a simulation inside Power BI.
As this was a POC, focus was less on deep predictive science and more on practical business value inside BI tooling.
Reporting
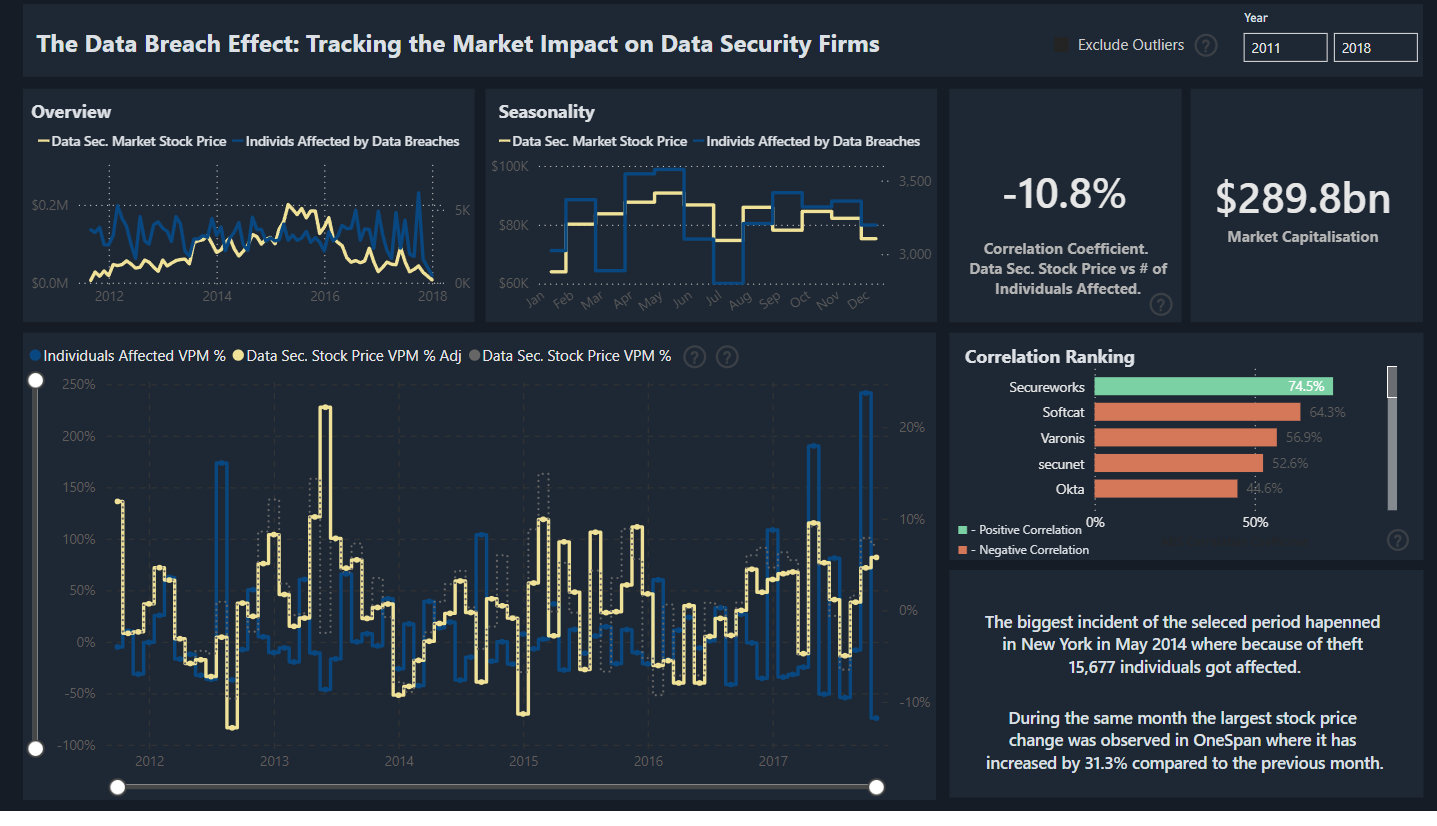
The first dashboard page (Market Overview) explores dependency patterns and lets users filter by company and period. The main dual-axis chart highlights relationships between people impacted by breaches and monthly stock price movement.
Because cyber stock prices were strongly correlated with broader market movement (Vanguard FTSE All-World), the report includes both raw and adjusted views.
The second page simulates breach impact by breach type and breached data location using regression coefficients, helping prioritize preparedness and response.
Visualizations
The dashboard uses a neutral dark theme. Color is used sparingly and consistently to separate metrics and communicate directional change.
Potential Next Steps
- Validate DAX correlation metrics more comprehensively under different filter contexts.
- Move the Python model logic directly into Power BI for continuous reporting.
- Improve model accuracy and expand predictors.
- Add market cap history to estimate dollar impact.
- Explore sentiment analysis after breach events.
Conclusion
Data science and BI can materially improve business decision-making under uncertainty. This project demonstrates how mixed-source datasets can be transformed into practical simulation tools for timely risk response.
Thanks
Huge thanks to Enterprise DNA, to Gaukhar for mentoring and support, and to the broader Power BI community.
Interactive Dashboard
Contacts
LinkedIn - Stepan Khramov