Full Steam Ahead: A Data Driven Analysis of the Belgian Railways
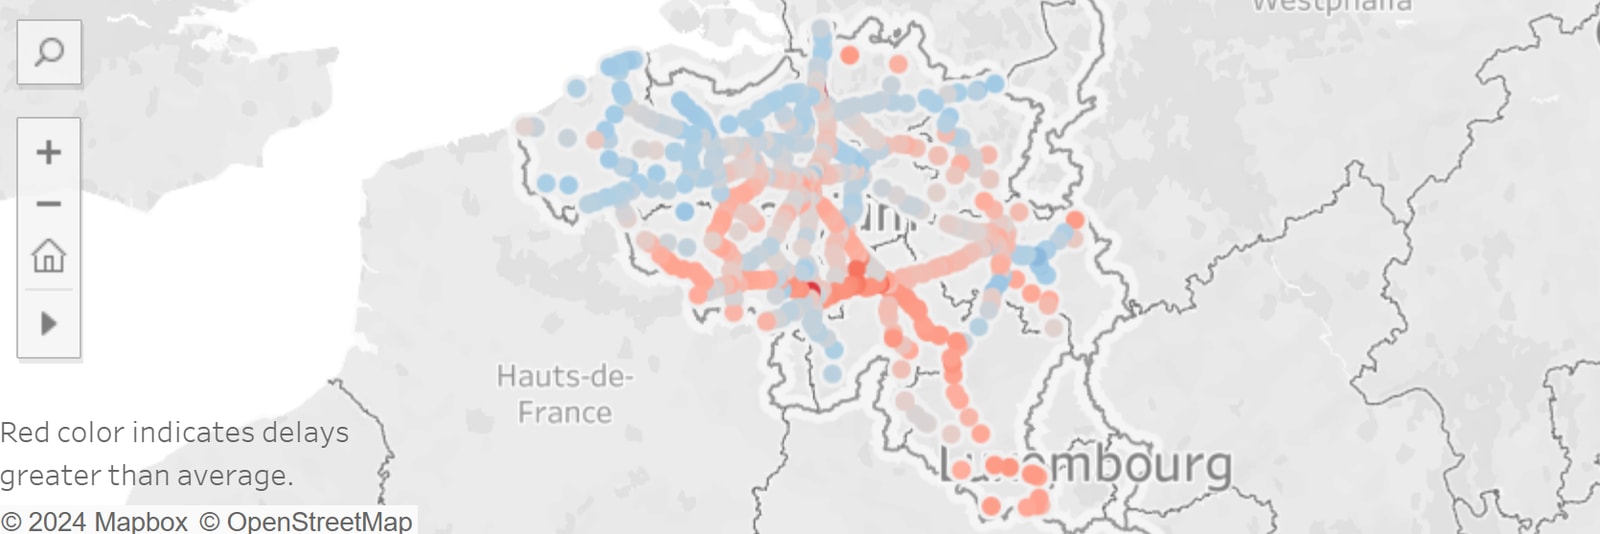
Delay map snapshot from the April 2019 analysis set.
While searching for a dataset to practice my newly acquired Tableau skills, I stumbled upon Infrabel's data on Belgian passenger train punctuality. This brought back memories of my daily commute from a small village in Flanders to my university in Brussels. This data instantly sparked so many questions.
Tool of Choice
I loaded over two million rows of passenger arrival-time data from April 2019 into Tableau, along with supporting metadata, then built interactive visualizations to explore patterns by date, location, and train type.


Metrics and Definitions
After ETL, the first high-level metric showed average arrival delay at a single station in Belgium of 2.13 minutes.
Then looked at system-level impact:
- A single train causes over 36 minutes of delay across its stops on average.
- Total daily delay across all trains exceeds 2000 hours.
- Delay distribution is uneven by geography, weekday, and time of day.
Baseline
Belgium reports 94.1% punctuality under its definition, but cross-country comparison is hard because European countries use different punctuality standards (5-minute vs 6-minute thresholds and other KPI differences).
According to a Boston Consulting Group report, Belgium approved a EUR25 billion railway investment plan in 2013 over 12 years. A standardized EU benchmarking method would make outcomes easier to evaluate.
Belgium vs European Neighbors
Infrabel indicates improving punctuality over time, but relative comparison remains unclear.
PRIME's 2017 benchmarking report provides one punctuality KPI and placed Belgium at 88.3% among the 15 studied countries. Using similar guidelines on April 2019 data yields about 88.86%, a slight improvement.
Contributing constraints include high network density and dependence on cross-border rail traffic.
Focus Point: Consistency
Looking at the first visuals of the article made me curious, how consistent are the delays? And how can we measure consistency? Does it even matter?

As a user, predictable small delays are often less damaging than occasional severe delays. Reliability matters as much as average punctuality.
Standard deviation for Belgian arrival delays is 5.77 minutes - more than double the average delay. Stations/dayparts with higher delays also show higher spread, reinforcing inconsistency risk.
The Bottleneck
Highest average delays are linked to international services (IZY, ICE, THAL, TGV, EURST). Although not all of these trains are the largest contributors to the total arrival delay, it is clear that international railways are a significant burden for Belgium.

Extra trains and rush-hour "P" trains are also major contributors, indicating capacity pressure.
Certain lines (e.g., IC25, IC16-1, IC19-1) stand out in total and average delay, making them priority candidates for system improvement.
Wrap-up
This project combined data visualization and transport analytics to investigate real passenger pain points. Despite some improvement in top-line punctuality, consistency and reliability remain key levers for meaningful user experience gains.
References
- Railengineer.co.uk. (2019). Every second counts - new measures of train punctuality.
- PRIME 2017 Data Benchmarking Report - Public Version.
- Opendata.infrabel.be. (2019). Tableau de bord - Ponctualite.
- BCG European Railway Performance Index publications.
Contacts
LinkedIn - Stepan Khramov