Puzzle of Product Returns: Proactive Quality Control
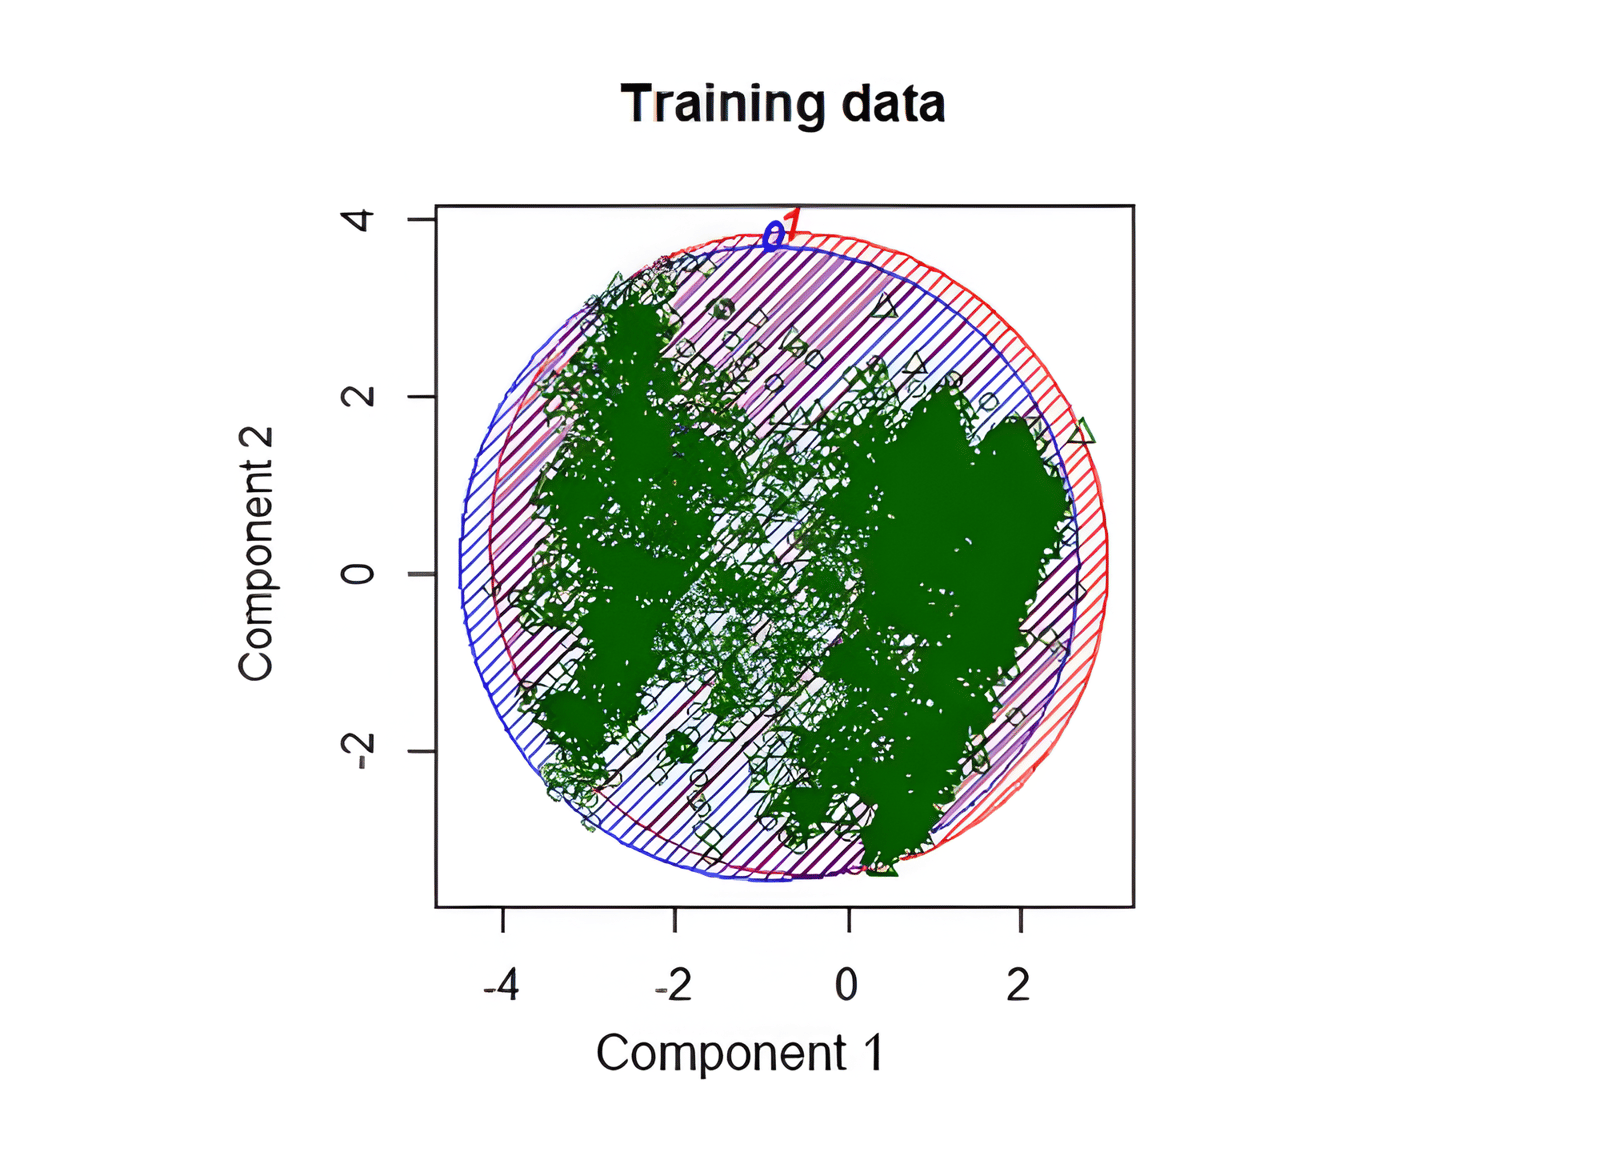
PCA projection used to inspect class separation in return-claim data.
On the last year of my MBA in International Business, I wanted a master's thesis grounded in analytical real-world problems. It became a major learning experience across messy data, global operations, and practical constraints.
Background
In online shopping and global operations, product returns are increasingly costly and can damage customer satisfaction and brand trust.
In B2C, returns are often preference-driven; in B2B, they are more frequently linked to logistics and quality issues. That B2B side is less explored in research and became the focus of this thesis.
Data and Company Context
The dataset included all order lines shipped in 2019 from a large manufacturing company (up to 1.5M lines), sourced from distribution-center SQL systems (Orders, Claims, and Warehouse Management).
Top return reasons included:
- Less parts than ordered (37%)
- Pricing issues (19%)
- Shipment never arrived (8%)
- PO mismatch (6%)
- Charges (5%)
- More parts than ordered (5%)
- Wrong parts sent (4%)
- Damage-related reasons (8% combined)
Class Imbalance
Out of roughly 1.5M shipped lines, only 4,182 had closed return claims (about 0.29%).
PCA visualization showed very limited separation between claimed and non-claimed observations, confirming a difficult prediction setup.
Sampling setup:
- Original dataset: 0.29% claim rate
- Testing sample: 0.32% claim rate (42,919 observations)
- Training sample: balanced 50/50 (5,922 observations)
Descriptive Analysis
The study included categorical and numeric predictors such as order type, pay terms, staging day/hour, gross weight, part family, business unit, picking/packing area, volume, region, carrier, and shipment-month index.
Most variables showed meaningful differences between return and non-return groups, indicating useful signal despite heavy imbalance.
Modeling
Core objectives:
- Test feasibility of reliable return prediction.
- Rank variables associated with return likelihood.
Models used:
- Logistic Regression
- Random Forest
- Naive Bayes
Evaluation used confusion matrices, ROC, and AUC. Multicollinearity checks (Chi-squared and Cramer's V) identified strong dependencies between volume vs gross weight and picking vs packing areas.
Accuracy ranged around 0.71-0.81 in balanced evaluation setups, but raw business applicability remained limited due to rare-event context.
Sensitivity vs Specificity
For proactive prevention, false negatives and false positives carry different operational costs; naive high-accuracy strategies are not useful when claim prevalence is low.
Random Forest delivered the strongest specificity (around 0.96), making it most useful for practical triage despite lower top-line accuracy.
Variable Importance and Outcome
Random Forest Mean Decrease Gini provided clear variable ranking aligned with descriptive findings.
Even without perfect prediction, the research identified that roughly 30% of shipping lines account for about 95% of returns. This enables targeted quality-control focus and stronger resource allocation.
Interactive Chart
Summary
Although the final model was not sufficiently precise for direct end-to-end prediction, the project produced actionable operational guidance: concentrated risk targeting, factor prioritization, and measurable improvement opportunities.